Stanwood
 Stanwood is the town center serving a diverse rural, suburban and urban population of 33,000 people spread across two counties in what is generally identified as “Greater Stanwood Camano” and the home of the single high school that serves the entire population.
Many residents outside the City come into Stanwood for business, community events and park and recreation services. The City is focusing on retaining its role as the center of the Greater Stanwood area by pursuing new endeavors that support the downtown and employment diversification. These efforts include the following initiatives.
- A successful year around farmers’ market and support of local food distribution
- Special events, festivals, and sports tournaments to attract additional foot traffic into the downtown
- Pursuing more effective means to address the flooding issues inherent in its location along the Stillaguamish River
- Promoting businesses that fit into the downtown plan and allow residents to find everything they need within Stanwood
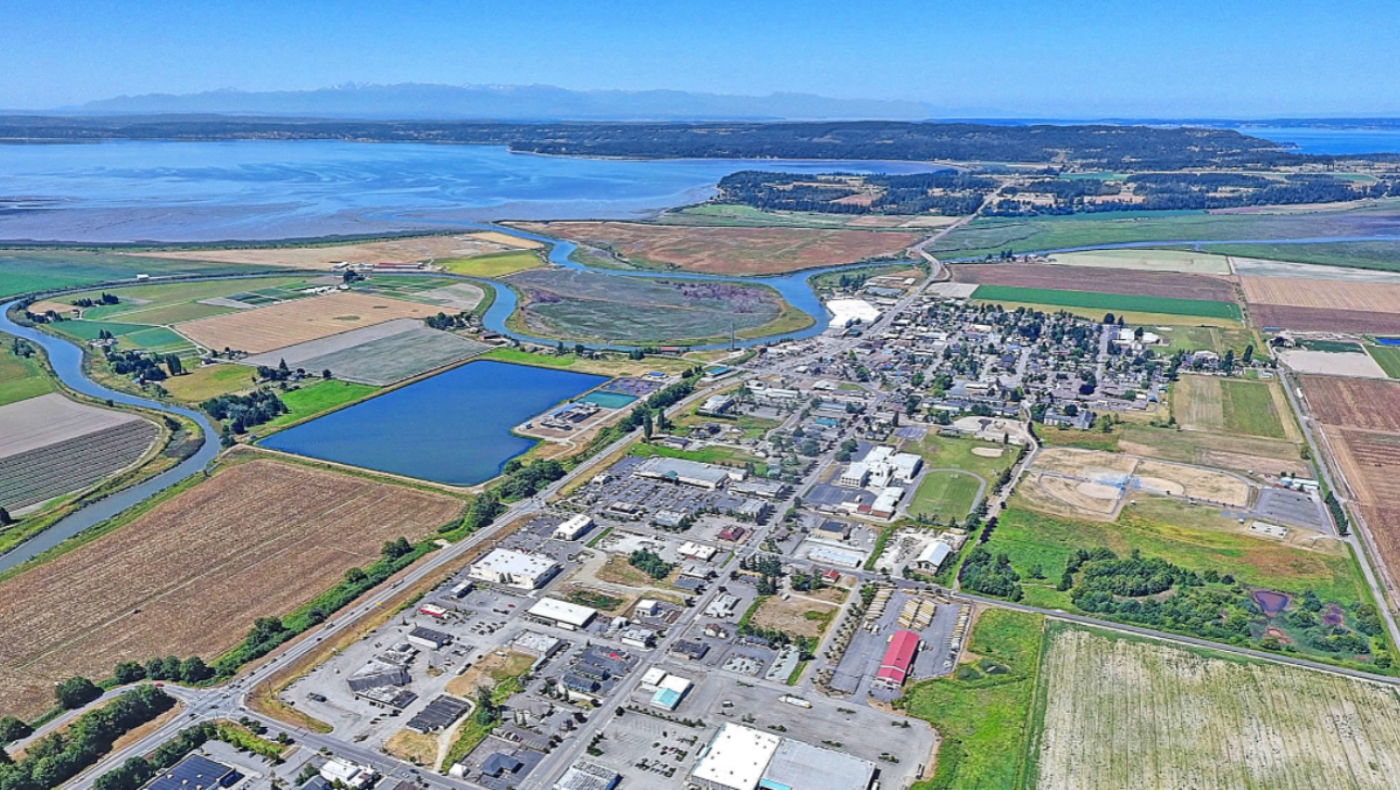
This area is rich in both scenic beauty and natural resources. Stanwood is geographically separated from the other urban areas of Snohomish County and is surrounded by unincorporated forested land, farm land, multiple sloughs, and the Stillaguamish Estuary, This setting affords a variety of both public and private recreational opportunities for the population. The proximity of the large population on Camano Island creates additional demand for services that is not accounted for in the typical economic analysis. Much of Stanwood’s cultural history is of Scandinavian heritage. Cultural influences have blended to form a community that is truly unique.
Distance From
- Work:
- Everett:30 minutes
- Lynnwood: 30 minutes
- Bellevue: 60 minutes
- Seattle: 60 minutes
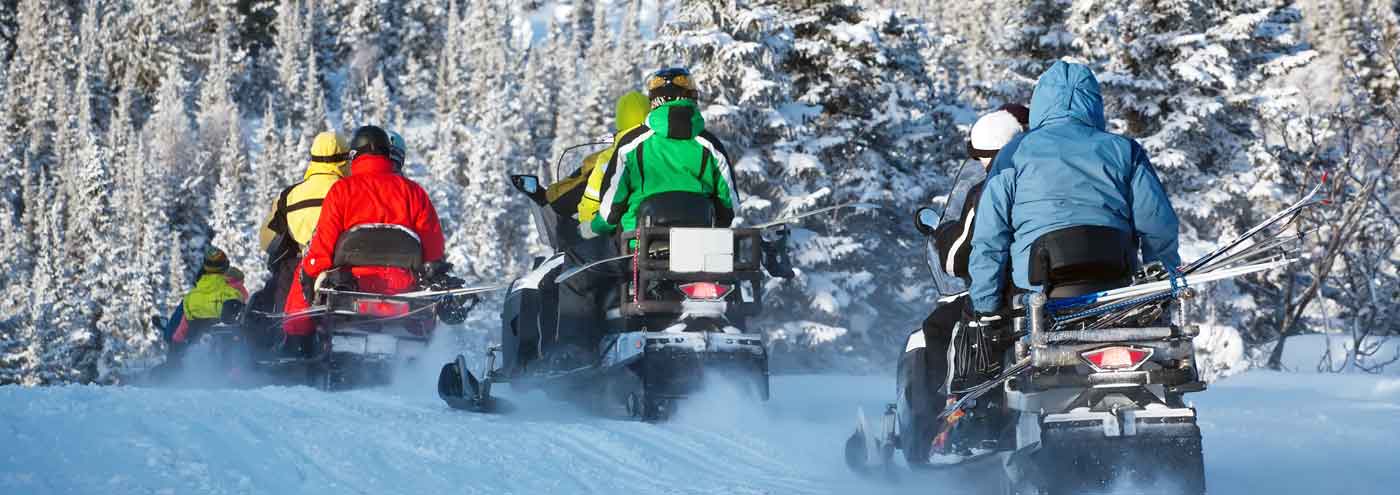
- Skiing: 30 minutes
- Boating: 15 minutes
K-12 School District
Major Employers
- Josephine Sunset Home (medical care)
- Haggen Grocery
- Providence Regional Medical Center
- Stanwood School District
Population
Population
| Population | 2000 | 2010 | 2025 | 2030 |
|---|---|---|---|---|
| Stanwood | 4,278 | 6,261 | 8,894 | 9,532 |
Source: ESRI, 2025-08-25
Population by Age
| Population | 2025 |
|---|---|
| 0-4 | 573 |
| 5-9 | 623 |
| 10-14 | 612 |
| 15-19 | 606 |
| 20-24 | 519 |
| 25-29 | 458 |
| 30-34 | 596 |
| 35-39 | 637 |
| 40-44 | 655 |
| 45-49 | 504 |
| 50-54 | 511 |
| 55-59 | 466 |
| 60-64 | 464 |
| 65-69 | 508 |
| 70-74 | 340 |
| 75-79 | 317 |
| 80-84 | 226 |
| 85+ | 279 |
| 18+ | 6,704 |
| Median Age | 39 |
Source: ESRI, 2025-08-25
Population by Race
| Stanwood | 2025 |
|---|---|
| Total | 8,894.00 |
| White Alone | 81.13% |
| Black Alone | 1.17% |
| American Indian Alone | 1.2% |
| Asian Alone | 2.39% |
| Pacific Islander Alone | 0.52% |
| Some Other Race | 4.17% |
| Two or More Races | 9.41% |
| Hispanic Origin | 9.76% |
| Diversity Index | 44.80 |
Source: ESRI, 2025-08-25
Growth Rate
| Stanwood | 2025 - 2030 |
|---|---|
| Population | 1.40% |
| Households | 1.45% |
| Families | 1.22% |
| Median Household Income | 3% |
| Per Capita Income | 3% |
Source: ESRI, 2025-08-25
Housing
Households
| Population | 2000 | 2010 | 2025 | 2030 |
|---|---|---|---|---|
| Households | 1,529 | 2,398 | 3,218 | 3,459 |
| Housing Units | 1,640 | 2,594 | 3,415 | 3,579 |
| Owner Occupied Units | 2,218 | 2,439 | ||
| Renter Occupied Units | 1,000 | 1,020 | ||
| Vacant Units | 197 | 120 |
Source: ESRI, 2025-08-25
Home Value
| Stanwood | 2025 | 2030 |
|---|---|---|
| Median Home Value | $617,403 | $670,410 |
| Average Home Value | $646,814 | $727,373 |
| <$50,000 | 14 | 3 |
| $50,000 - $99,999 | 0 | 0 |
| $100,000 - $149,999 | 0 | 0 |
| $150,000 - $199,999 | 3 | 0 |
| $200,000 - $249,999 | 11 | 0 |
| $250,000 - $299,999 | 12 | 0 |
| $300,000 - $399,999 | 74 | 10 |
| $400,000 - $499,999 | 400 | 167 |
| $500,000 - $749,999 | 1,267 | 1,525 |
| $1,000,000 + | 31 | 84 |
Source: ESRI, 2025-08-25
Housing Year Built
| Year Range | Houses Built |
|---|---|
| 2010 or Later | 503 |
| 2000-2009 | 853 |
| 1990-1999 | 750 |
| 1980-1989 | 317 |
| 1970-1979 | 182 |
| 1960-1969 | 62 |
| 1950-1959 | 19 |
| 1940-1949 | 96 |
| 1939 or Before | 201 |
Source: ESRI, 2025-08-25
Back To TopIncome
Income
| Stanwood | 2025 | 2030 |
|---|---|---|
| Median Household | $92,947 | $109,030 |
| Average Household | $124,522 | $143,770 |
| Per Capita | $45,129 | $52,242 |
Source: ESRI, 2025-08-25
Household Income
| Stanwood | 2025 |
|---|---|
| <$15,000 | 358 |
| $15,000 - $24,999 | 124 |
| $25,000 - $34,999 | 123 |
| $35,000 - $49,999 | 218 |
| $50,000 - $74,999 | 449 |
| $75,000 - $99,999 | 438 |
| $100,000 - $149,999 | 648 |
| $150,000 - $199,999 | 338 |
| $200,000+ | 522 |
Source: ESRI, 2025-08-25
Back To TopEmployees
Commute
| Category | Commuters |
|---|---|
| Workers 16+ | 3,306 |
| In-County Residents | 2,297 |
| Out-of-County Residents | 924 |
| Drive Alone | 2,638 |
| Carpooled | 320 |
| Public Transport | 42 |
| Work at Home | 294 |
| Motorcycle | 0 |
| Bicycle | 0 |
| Walked | 0 |
| Other | 12 |
| Less than 5 minutes | 100 |
| 5-9 minutes | 312 |
| 10-14 minutes | 176 |
| 15-19 minutes | 91 |
| 20-24 minutes | 345 |
| 25-29 minutes | 173 |
| 30-34 minutes | 540 |
| 35-39 minutes | 107 |
| 40-44 minutes | 303 |
| 45-59 minutes | 226 |
| 60-89 minutes | 532 |
| 90+ minutes | 107 |
| Average Travel Time | 35 |
Source: ESRI, 2025-08-25
Source: ESRI, 2025-08-25
Employees by NAICS
| Category | Number |
|---|---|
| Total Employees | 4,185 |
| Agr/Forestry/Fish/Hunt | 0 |
| Mining | 0 |
| Utilities | 25 |
| Construction | 47 |
| Manufacturing | 224 |
| Wholesale Trade | 15 |
| Retail Trade | 640 |
| Motor Veh/Parts Dealers | 56 |
| Furn & Home Furnish Str | 10 |
| Electronics & Appl Store | 0 |
| Bldg Matl/Garden Equip | 47 |
| Food & Beverage Stores | 322 |
| Health/Pers Care Stores | 125 |
| Gasoline Stations | 11 |
| Clothing/Accessory Store | 3 |
| Sports/Hobby/Book/Music | 43 |
| General Merchandise Str | 23 |
| Transportation/Warehouse | 165 |
| Information | 65 |
| Finance & Insurance | 138 |
| Cntrl Bank/Crdt Intrmdtn | 69 |
| Sec/Cmdty Cntrct/Oth Inv | 24 |
| Insur/Funds/Trusts/Other | 45 |
| Real Estate/Rent/Leasing | 92 |
| Prof/Scientific/Tech Srv | 217 |
| Legal Services | 34 |
| Mgmt of Comp/Enterprises | 30 |
| Admin/Support/Waste Mgmt | 48 |
| Educational Services | 396 |
| HealthCare/Social Assist | 960 |
| Arts/Entertainment/Rec | 22 |
| Accommodation/Food Srvcs | 535 |
| Accommodation | 7 |
| Food Srv/Drinking Places | 528 |
| Other Srv excl Pub Admin | 375 |
| Auto Repair/Maintenance | 100 |
| Public Administration Emp | 185 |
Source: ESRI, 2025-08-25
Educational Attainment (25+)
| Stanwood | 2025 |
|---|---|
| <9th Grade | 97 |
| Some High School | 201 |
| GED | 301 |
| Graduated High School | 1,646 |
| Some College/No Degree | 1,611 |
| Associates Degree | 456 |
| Bachelor's Degree | 1,044 |
| Graduate Degree | 605 |
Source: ESRI, 2025-08-25
Back To TopBusinesses
Businesses by NAICS
| Category | Number |
|---|---|
| Total Businesses | 415 |
| Agr/Forestry/Fish/Hunt Bus | 0 |
| Mining Bus | 0 |
| Utilities Bus | 1 |
| Construction Bus | 16 |
| Manufacturing Bus | 8 |
| Wholesale Trade Bus | 4 |
| Retail Trade Bus | 53 |
| Motor Veh/Parts Dealers Bus | 7 |
| Furn & Home Furnish Str Bus | 1 |
| Electronics & Appl Store Bus | 0 |
| Bldg Matl/Garden Equip Bus | 6 |
| Food & Beverage Stores Bus | 10 |
| Health/Pers Care Stores Bus | 10 |
| Gasoline Stations Bus | 2 |
| Clothing/Accessory Store Bus | 1 |
| Sports/Hobby/Book/Music Bus | 12 |
| General Merchandise Str Bus | 4 |
| Transportation/Warehouse Bus | 7 |
| Information Bus | 8 |
| Finance & Insurance Bus | 29 |
| Cntrl Bank/Crdt Intrmdtn Bus | 10 |
| Sec/Cmdty Cntrct/Oth Inv Bus | 10 |
| Insur/Funds/Trusts/Other Bus | 9 |
| Real Estate/Rent/Leasing Bus | 19 |
| Prof/Scientific/Tech Srv Bus | 44 |
| Legal Services Bus | 9 |
| Mgmt of Comp/Enterprises Bus | 1 |
| Admin/Support/Waste Mgmt Bus | 8 |
| Educational Services Bus | 13 |
| HealthCare/Social Assist Bus | 50 |
| Arts/Entertainment/Rec Bus | 7 |
| Accommodation/Food Srvcs Bus | 51 |
| Accommodation Bus | 2 |
| Food Srv/Drinking Places Bus | 49 |
| Other Srv excl Pub Admin Bus | 79 |
| Auto Repair/Maintenance Bus | 10 |
| Public Administration Bus | 11 |
Source: ESRI, 2025-08-25
Back To Top