Snohomish
 As the oldest and best preserved city in Snohomish County, Snohomish is listed on both the Washington State and National Register of Historic Places.
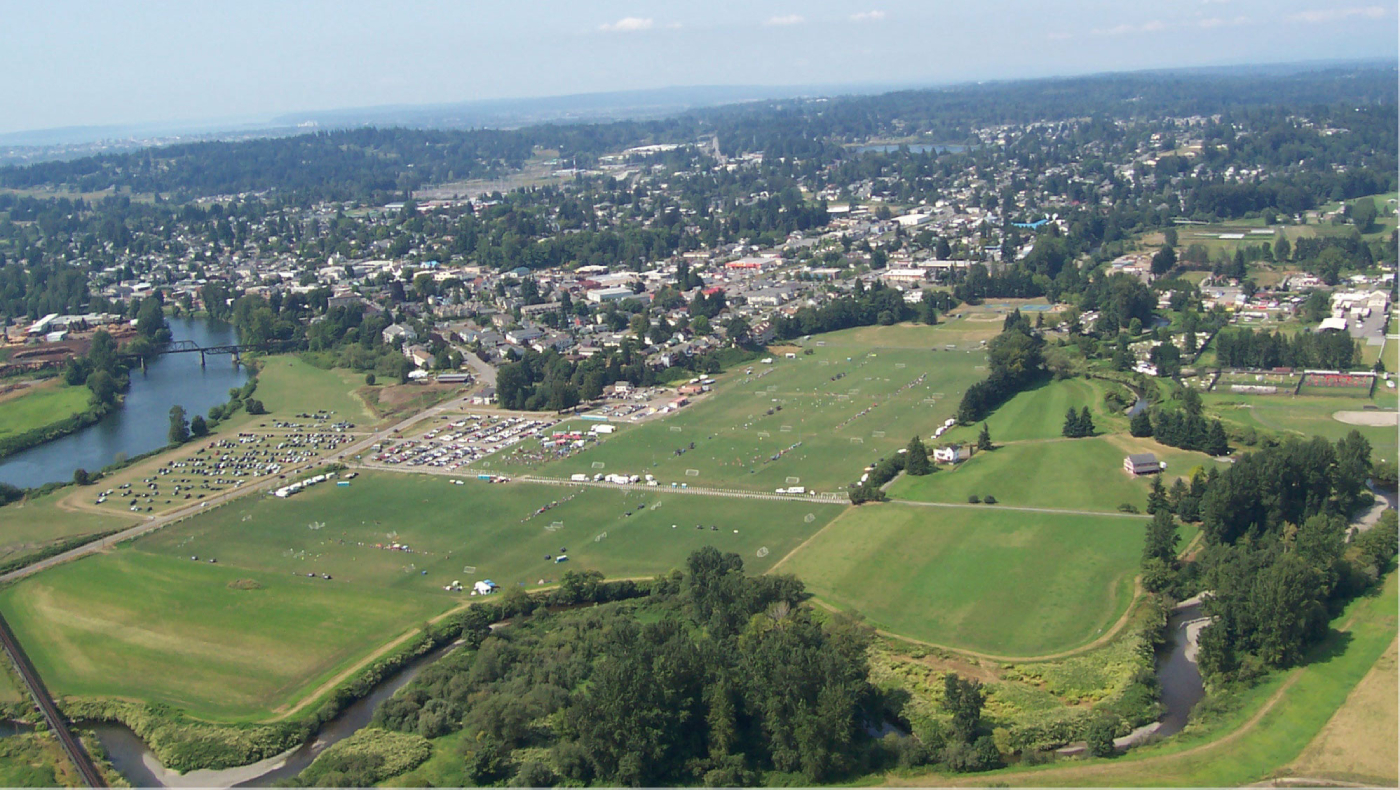
Today, you can stroll along riverfront trails or walk through historic tree-lined neighborhoods that still provide identical views seen by the First People of Snohomish (The Sdoh-doh-hohbsh) or the early pioneer settlers who expanded commerce on First Street.
The next cool startup will probably begin in Snohomish, kind of like Funko, which started its humble beginnings as a home occupancy in a Snohomish garage. With access to talent, capital and our low overhead, innovators can afford to, well innovate. And when you need a break from all that innovating, you can hit the refresh button with other makers who just happen to create the region’s most exquisite small-batch craft beer, wine and spirits.
Business and employment climates are robust in SnoTown, mirroring the greater Pacific Northwest’s thriving economy. Light manufacturing, professional services and retail are our bread and butter with room for growth in consumer packaged food, and textile manufacturing.
The Snohomish School District is continually recognized as a leader in education and is proactive in providing training programs that educate the workforce of the future such as their renowned machining pathways and biomedical pathways programs.
Distance From
- Work:
- Everett:15 minutes
- Lynnwood: 20 minutes
- Bellevue: 45 minutes
- Seattle: 45 minutes
- Skiing: 30 minutes
- Boating: 15 minutes
K-12 School District
Major Employers
- Bickford Motors
- Lamb and Co.
- Pilchuck Veterinary Hospital
- Snohomish School District
- Snohomish Health and Rehabilitation
Population
Population
| Population | 2000 | 2010 | 2025 | 2030 |
|---|---|---|---|---|
| Snohomish | 9,031 | 9,136 | 10,282 | 10,597 |
Source: ESRI, 2025-08-25
Population by Age
| Population | 2025 |
|---|---|
| 0-4 | 560 |
| 5-9 | 610 |
| 10-14 | 509 |
| 15-19 | 564 |
| 20-24 | 569 |
| 25-29 | 626 |
| 30-34 | 746 |
| 35-39 | 771 |
| 40-44 | 822 |
| 45-49 | 617 |
| 50-54 | 614 |
| 55-59 | 614 |
| 60-64 | 703 |
| 65-69 | 606 |
| 70-74 | 514 |
| 75-79 | 422 |
| 80-84 | 227 |
| 85+ | 188 |
| 18+ | 8,246 |
| Median Age | 41 |
Source: ESRI, 2025-08-25
Population by Race
| Snohomish | 2025 |
|---|---|
| Total | 10,282.00 |
| White Alone | 78.9% |
| Black Alone | 0.76% |
| American Indian Alone | 0.67% |
| Asian Alone | 2.67% |
| Pacific Islander Alone | 0.53% |
| Some Other Race | 5.92% |
| Two or More Races | 10.53% |
| Hispanic Origin | 11.58% |
| Diversity Index | 49.30 |
Source: ESRI, 2025-08-25
Growth Rate
| Snohomish | 2025 - 2030 |
|---|---|
| Population | 0.61% |
| Households | 0.64% |
| Families | 0.58% |
| Median Household Income | 4% |
| Per Capita Income | 3% |
Source: ESRI, 2025-08-25
Housing
Households
| Population | 2000 | 2010 | 2025 | 2030 |
|---|---|---|---|---|
| Households | 3,474 | 3,659 | 4,314 | 4,453 |
| Housing Units | 3,643 | 3,973 | 4,447 | 4,584 |
| Owner Occupied Units | 2,615 | 2,845 | ||
| Renter Occupied Units | 1,699 | 1,608 | ||
| Vacant Units | 133 | 131 |
Source: ESRI, 2025-08-25
Home Value
| Snohomish | 2025 | 2030 |
|---|---|---|
| Median Home Value | $800,027 | $908,965 |
| Average Home Value | $874,826 | $1,022,220 |
| <$50,000 | 36 | 8 |
| $50,000 - $99,999 | 11 | 2 |
| $100,000 - $149,999 | 8 | 0 |
| $150,000 - $199,999 | 1 | 0 |
| $200,000 - $249,999 | 5 | 0 |
| $250,000 - $299,999 | 5 | 0 |
| $300,000 - $399,999 | 65 | 8 |
| $400,000 - $499,999 | 155 | 63 |
| $500,000 - $749,999 | 837 | 595 |
| $1,000,000 + | 401 | 713 |
Source: ESRI, 2025-08-25
Housing Year Built
| Year Range | Houses Built |
|---|---|
| 2010 or Later | 235 |
| 2000-2009 | 697 |
| 1990-1999 | 640 |
| 1980-1989 | 542 |
| 1970-1979 | 478 |
| 1960-1969 | 624 |
| 1950-1959 | 415 |
| 1940-1949 | 205 |
| 1939 or Before | 841 |
Source: ESRI, 2025-08-25
Back To TopIncome
Income
| Snohomish | 2025 | 2030 |
|---|---|---|
| Median Household | $96,364 | $115,149 |
| Average Household | $120,460 | $137,866 |
| Per Capita | $50,590 | $57,981 |
Source: ESRI, 2025-08-25
Household Income
| Snohomish | 2025 |
|---|---|
| <$15,000 | 306 |
| $15,000 - $24,999 | 201 |
| $25,000 - $34,999 | 240 |
| $35,000 - $49,999 | 416 |
| $50,000 - $74,999 | 582 |
| $75,000 - $99,999 | 467 |
| $100,000 - $149,999 | 836 |
| $150,000 - $199,999 | 558 |
| $200,000+ | 708 |
Source: ESRI, 2025-08-25
Back To TopEmployees
Commute
| Category | Commuters |
|---|---|
| Workers 16+ | 4,474 |
| In-County Residents | 3,314 |
| Out-of-County Residents | 1,130 |
| Drive Alone | 3,338 |
| Carpooled | 311 |
| Public Transport | 84 |
| Work at Home | 543 |
| Motorcycle | 0 |
| Bicycle | 0 |
| Walked | 147 |
| Other | 51 |
| Less than 5 minutes | 147 |
| 5-9 minutes | 267 |
| 10-14 minutes | 238 |
| 15-19 minutes | 481 |
| 20-24 minutes | 620 |
| 25-29 minutes | 290 |
| 30-34 minutes | 511 |
| 35-39 minutes | 120 |
| 40-44 minutes | 194 |
| 45-59 minutes | 468 |
| 60-89 minutes | 428 |
| 90+ minutes | 167 |
| Average Travel Time | 32 |
Source: ESRI, 2025-08-25
Source: ESRI, 2025-08-25
Employees by NAICS
| Category | Number |
|---|---|
| Total Employees | 6,209 |
| Agr/Forestry/Fish/Hunt | 10 |
| Mining | 0 |
| Utilities | 20 |
| Construction | 500 |
| Manufacturing | 160 |
| Wholesale Trade | 141 |
| Retail Trade | 1,244 |
| Motor Veh/Parts Dealers | 250 |
| Furn & Home Furnish Str | 30 |
| Electronics & Appl Store | 12 |
| Bldg Matl/Garden Equip | 94 |
| Food & Beverage Stores | 391 |
| Health/Pers Care Stores | 101 |
| Gasoline Stations | 45 |
| Clothing/Accessory Store | 39 |
| Sports/Hobby/Book/Music | 152 |
| General Merchandise Str | 130 |
| Transportation/Warehouse | 95 |
| Information | 66 |
| Finance & Insurance | 173 |
| Cntrl Bank/Crdt Intrmdtn | 106 |
| Sec/Cmdty Cntrct/Oth Inv | 25 |
| Insur/Funds/Trusts/Other | 42 |
| Real Estate/Rent/Leasing | 190 |
| Prof/Scientific/Tech Srv | 297 |
| Legal Services | 43 |
| Mgmt of Comp/Enterprises | 0 |
| Admin/Support/Waste Mgmt | 171 |
| Educational Services | 639 |
| HealthCare/Social Assist | 869 |
| Arts/Entertainment/Rec | 85 |
| Accommodation/Food Srvcs | 816 |
| Accommodation | 20 |
| Food Srv/Drinking Places | 796 |
| Other Srv excl Pub Admin | 563 |
| Auto Repair/Maintenance | 80 |
| Public Administration Emp | 168 |
Source: ESRI, 2025-08-25
Educational Attainment (25+)
| Snohomish | 2025 |
|---|---|
| <9th Grade | 102 |
| Some High School | 429 |
| GED | 294 |
| Graduated High School | 1,235 |
| Some College/No Degree | 1,837 |
| Associates Degree | 1,007 |
| Bachelor's Degree | 1,849 |
| Graduate Degree | 717 |
Source: ESRI, 2025-08-25
Back To TopBusinesses
Businesses by NAICS
| Category | Number |
|---|---|
| Total Businesses | 759 |
| Agr/Forestry/Fish/Hunt Bus | 4 |
| Mining Bus | 0 |
| Utilities Bus | 1 |
| Construction Bus | 64 |
| Manufacturing Bus | 31 |
| Wholesale Trade Bus | 18 |
| Retail Trade Bus | 110 |
| Motor Veh/Parts Dealers Bus | 15 |
| Furn & Home Furnish Str Bus | 7 |
| Electronics & Appl Store Bus | 3 |
| Bldg Matl/Garden Equip Bus | 13 |
| Food & Beverage Stores Bus | 15 |
| Health/Pers Care Stores Bus | 10 |
| Gasoline Stations Bus | 8 |
| Clothing/Accessory Store Bus | 11 |
| Sports/Hobby/Book/Music Bus | 22 |
| General Merchandise Str Bus | 6 |
| Transportation/Warehouse Bus | 6 |
| Information Bus | 10 |
| Finance & Insurance Bus | 34 |
| Cntrl Bank/Crdt Intrmdtn Bus | 14 |
| Sec/Cmdty Cntrct/Oth Inv Bus | 8 |
| Insur/Funds/Trusts/Other Bus | 12 |
| Real Estate/Rent/Leasing Bus | 38 |
| Prof/Scientific/Tech Srv Bus | 63 |
| Legal Services Bus | 9 |
| Mgmt of Comp/Enterprises Bus | 0 |
| Admin/Support/Waste Mgmt Bus | 22 |
| Educational Services Bus | 19 |
| HealthCare/Social Assist Bus | 87 |
| Arts/Entertainment/Rec Bus | 21 |
| Accommodation/Food Srvcs Bus | 73 |
| Accommodation Bus | 2 |
| Food Srv/Drinking Places Bus | 71 |
| Other Srv excl Pub Admin Bus | 134 |
| Auto Repair/Maintenance Bus | 17 |
| Public Administration Bus | 10 |
Source: ESRI, 2025-08-25
Back To Top