Granite Falls
 Nestled in the shadow of Mr. Pilchuck, bounded by the Stillaguamish and Pilchuck rivers, Granite Falls is that perfect stop-over before or after a mountain excursion.
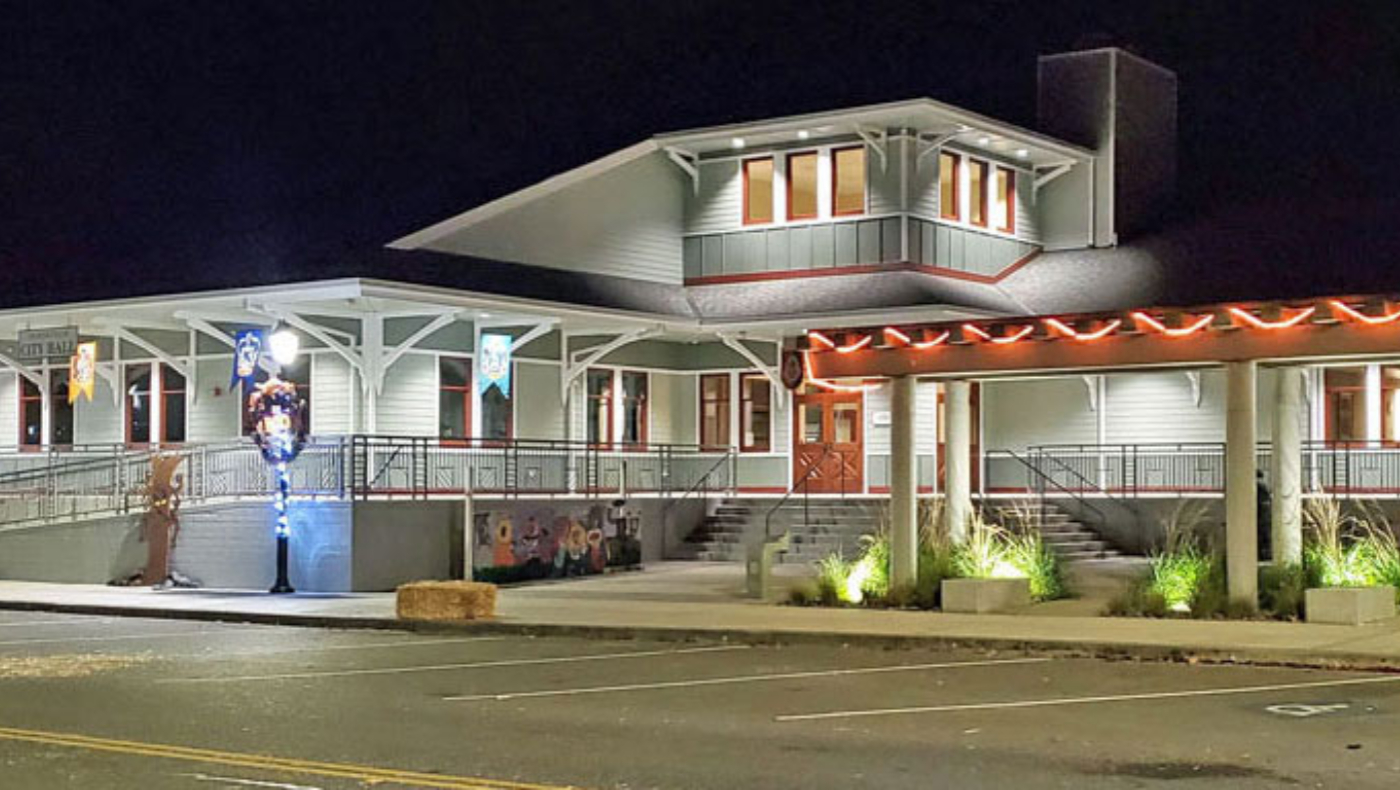
This “Gateway to the Mountain Loop” is enhanced by turn-of-the-century architecture, unique businesses and eateries, and a distinct western foothills atmosphere.
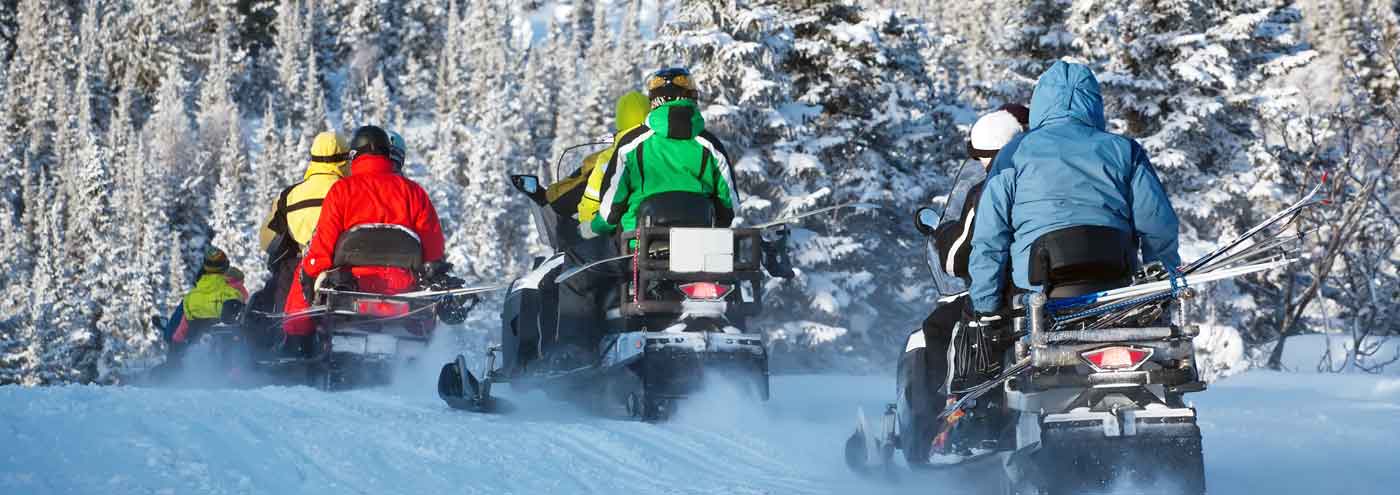
Big Four Ice Caves, the ghost town of Monte Cristo, and over a dozen hiking trails are popular destinations, and only minutes from downtown Granite Falls along scenic Mountain Loop Highway. You can tour the town or tour “the Loop” on your cell phone or PC, enjoying narrated slide shows including “then and now” pictures of the sights along the way.
Oldest car show in the state, pre-Thanksgiving and pre-Easter Turkey Shoots, Easter egg hunts, Railroad (and school) Reunion Days, Christmas Tree lighting, active Senior Center, outstanding Boys and Girls Club, award-winning Historical Museum, downtown skate park and lake waterfront park, autumn city-wide “Night Out”, popular dog park, waterfall and fish ladder.
Distance From
- Work:
- Everett:25 minutes
- Bellevue: 60 minutes
- Seattle: 90 minutes
- Skiing: 90 minutes
- Boating: 30 minutes
K-12 School District
Major Employers
- B.I.C., Inc
- Checkmate Industries, Inc.
- Cobalt Enterprises
- FSX Equipment, Inc.
Population
Population
| Population | 2000 | 2010 | 2025 | 2030 |
|---|---|---|---|---|
| Granite Falls | 2,463 | 3,374 | 5,143 | 5,400 |
Source: ESRI, 2025-08-25
Population by Age
| Population | 2025 |
|---|---|
| 0-4 | 335 |
| 5-9 | 375 |
| 10-14 | 335 |
| 15-19 | 301 |
| 20-24 | 261 |
| 25-29 | 356 |
| 30-34 | 413 |
| 35-39 | 410 |
| 40-44 | 370 |
| 45-49 | 337 |
| 50-54 | 296 |
| 55-59 | 309 |
| 60-64 | 307 |
| 65-69 | 247 |
| 70-74 | 191 |
| 75-79 | 144 |
| 80-84 | 78 |
| 85+ | 78 |
| 18+ | 3,922 |
| Median Age | 37 |
Source: ESRI, 2025-08-25
Population by Race
| Granite Falls | 2025 |
|---|---|
| Total | 5,143.00 |
| White Alone | 79.18% |
| Black Alone | 1.19% |
| American Indian Alone | 1.3% |
| Asian Alone | 2.78% |
| Pacific Islander Alone | 0.19% |
| Some Other Race | 4.39% |
| Two or More Races | 10.97% |
| Hispanic Origin | 9.14% |
| Diversity Index | 46.50 |
Source: ESRI, 2025-08-25
Growth Rate
| Granite Falls | 2025 - 2030 |
|---|---|
| Population | 0.98% |
| Households | 0.91% |
| Families | 0.24% |
| Median Household Income | 2% |
| Per Capita Income | 2% |
Source: ESRI, 2025-08-25
Housing
Households
| Population | 2000 | 2010 | 2025 | 2030 |
|---|---|---|---|---|
| Households | 885 | 1,228 | 1,750 | 1,831 |
| Housing Units | 914 | 1,350 | 1,812 | 1,895 |
| Owner Occupied Units | 1,323 | 1,443 | ||
| Renter Occupied Units | 427 | 388 | ||
| Vacant Units | 62 | 64 |
Source: ESRI, 2025-08-25
Home Value
| Granite Falls | 2025 | 2030 |
|---|---|---|
| Median Home Value | $724,279 | $819,853 |
| Average Home Value | $742,247 | $854,768 |
| <$50,000 | 2 | 1 |
| $50,000 - $99,999 | 1 | 0 |
| $100,000 - $149,999 | 6 | 0 |
| $150,000 - $199,999 | 7 | 0 |
| $200,000 - $249,999 | 9 | 0 |
| $250,000 - $299,999 | 12 | 0 |
| $300,000 - $399,999 | 35 | 4 |
| $400,000 - $499,999 | 123 | 47 |
| $500,000 - $749,999 | 520 | 489 |
| $1,000,000 + | 112 | 224 |
Source: ESRI, 2025-08-25
Housing Year Built
| Year Range | Houses Built |
|---|---|
| 2010 or Later | 228 |
| 2000-2009 | 286 |
| 1990-1999 | 727 |
| 1980-1989 | 178 |
| 1970-1979 | 118 |
| 1960-1969 | 47 |
| 1950-1959 | 32 |
| 1940-1949 | 0 |
| 1939 or Before | 155 |
Source: ESRI, 2025-08-25
Back To TopIncome
Income
| Granite Falls | 2025 | 2030 |
|---|---|---|
| Median Household | $98,733 | $110,478 |
| Average Household | $113,369 | $125,881 |
| Per Capita | $38,623 | $42,728 |
Source: ESRI, 2025-08-25
Household Income
| Granite Falls | 2025 |
|---|---|
| <$15,000 | 148 |
| $15,000 - $24,999 | 99 |
| $25,000 - $34,999 | 49 |
| $35,000 - $49,999 | 72 |
| $50,000 - $74,999 | 261 |
| $75,000 - $99,999 | 256 |
| $100,000 - $149,999 | 432 |
| $150,000 - $199,999 | 270 |
| $200,000+ | 163 |
Source: ESRI, 2025-08-25
Back To TopEmployees
Commute
| Category | Commuters |
|---|---|
| Workers 16+ | 2,254 |
| In-County Residents | 2,071 |
| Out-of-County Residents | 183 |
| Drive Alone | 1,741 |
| Carpooled | 75 |
| Public Transport | 3 |
| Work at Home | 322 |
| Motorcycle | 5 |
| Bicycle | 42 |
| Walked | 36 |
| Other | 30 |
| Less than 5 minutes | 17 |
| 5-9 minutes | 102 |
| 10-14 minutes | 155 |
| 15-19 minutes | 54 |
| 20-24 minutes | 145 |
| 25-29 minutes | 248 |
| 30-34 minutes | 300 |
| 35-39 minutes | 86 |
| 40-44 minutes | 184 |
| 45-59 minutes | 239 |
| 60-89 minutes | 298 |
| 90+ minutes | 105 |
| Average Travel Time | 0 |
Source: ESRI, 2025-08-25
Source: ESRI, 2025-08-25
Employees by NAICS
| Category | Number |
|---|---|
| Total Employees | 1,197 |
| Agr/Forestry/Fish/Hunt | 2 |
| Mining | 0 |
| Utilities | 0 |
| Construction | 60 |
| Manufacturing | 183 |
| Wholesale Trade | 23 |
| Retail Trade | 147 |
| Motor Veh/Parts Dealers | 17 |
| Furn & Home Furnish Str | 0 |
| Electronics & Appl Store | 0 |
| Bldg Matl/Garden Equip | 15 |
| Food & Beverage Stores | 78 |
| Health/Pers Care Stores | 31 |
| Gasoline Stations | 4 |
| Clothing/Accessory Store | 0 |
| Sports/Hobby/Book/Music | 2 |
| General Merchandise Str | 0 |
| Transportation/Warehouse | 3 |
| Information | 1 |
| Finance & Insurance | 9 |
| Cntrl Bank/Crdt Intrmdtn | 8 |
| Sec/Cmdty Cntrct/Oth Inv | 1 |
| Insur/Funds/Trusts/Other | 0 |
| Real Estate/Rent/Leasing | 50 |
| Prof/Scientific/Tech Srv | 7 |
| Legal Services | 0 |
| Mgmt of Comp/Enterprises | 0 |
| Admin/Support/Waste Mgmt | 5 |
| Educational Services | 257 |
| HealthCare/Social Assist | 107 |
| Arts/Entertainment/Rec | 42 |
| Accommodation/Food Srvcs | 125 |
| Accommodation | 0 |
| Food Srv/Drinking Places | 125 |
| Other Srv excl Pub Admin | 83 |
| Auto Repair/Maintenance | 0 |
| Public Administration Emp | 90 |
Source: ESRI, 2025-08-25
Educational Attainment (25+)
| Granite Falls | 2025 |
|---|---|
| <9th Grade | 49 |
| Some High School | 168 |
| GED | 172 |
| Graduated High School | 1,127 |
| Some College/No Degree | 595 |
| Associates Degree | 528 |
| Bachelor's Degree | 660 |
| Graduate Degree | 237 |
Source: ESRI, 2025-08-25
Back To TopBusinesses
Businesses by NAICS
| Category | Number |
|---|---|
| Total Businesses | 120 |
| Agr/Forestry/Fish/Hunt Bus | 1 |
| Mining Bus | 0 |
| Utilities Bus | 0 |
| Construction Bus | 8 |
| Manufacturing Bus | 9 |
| Wholesale Trade Bus | 2 |
| Retail Trade Bus | 15 |
| Motor Veh/Parts Dealers Bus | 3 |
| Furn & Home Furnish Str Bus | 0 |
| Electronics & Appl Store Bus | 0 |
| Bldg Matl/Garden Equip Bus | 2 |
| Food & Beverage Stores Bus | 4 |
| Health/Pers Care Stores Bus | 4 |
| Gasoline Stations Bus | 1 |
| Clothing/Accessory Store Bus | 0 |
| Sports/Hobby/Book/Music Bus | 1 |
| General Merchandise Str Bus | 0 |
| Transportation/Warehouse Bus | 1 |
| Information Bus | 1 |
| Finance & Insurance Bus | 3 |
| Cntrl Bank/Crdt Intrmdtn Bus | 2 |
| Sec/Cmdty Cntrct/Oth Inv Bus | 1 |
| Insur/Funds/Trusts/Other Bus | 0 |
| Real Estate/Rent/Leasing Bus | 6 |
| Prof/Scientific/Tech Srv Bus | 3 |
| Legal Services Bus | 0 |
| Mgmt of Comp/Enterprises Bus | 0 |
| Admin/Support/Waste Mgmt Bus | 2 |
| Educational Services Bus | 6 |
| HealthCare/Social Assist Bus | 16 |
| Arts/Entertainment/Rec Bus | 2 |
| Accommodation/Food Srvcs Bus | 14 |
| Accommodation Bus | 0 |
| Food Srv/Drinking Places Bus | 14 |
| Other Srv excl Pub Admin Bus | 22 |
| Auto Repair/Maintenance Bus | 0 |
| Public Administration Bus | 5 |
Source: ESRI, 2025-08-25
Back To Top