Darrington
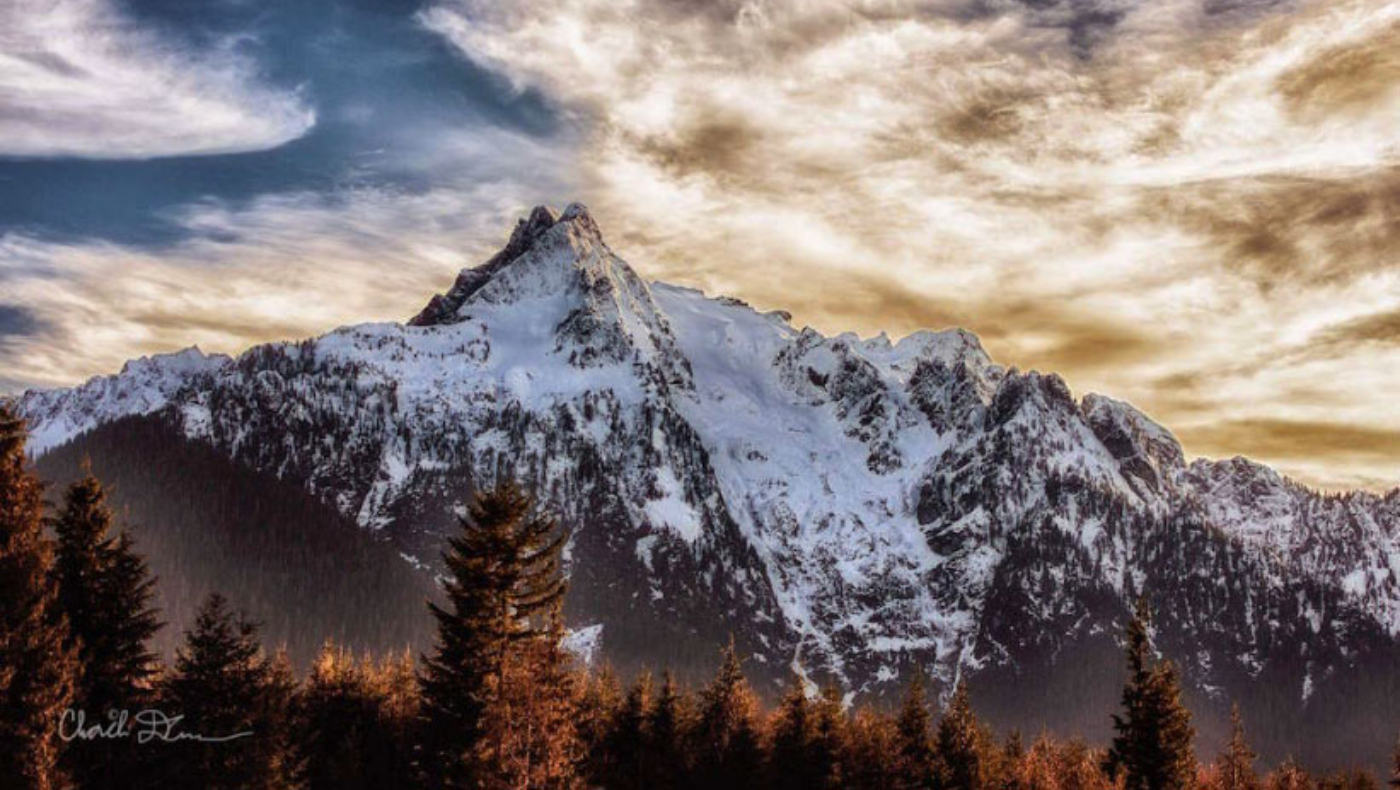
 If you’re considering a visit to Darrington, try to bring some binoculars and a camera because this is one of the most beautiful places in the United States.
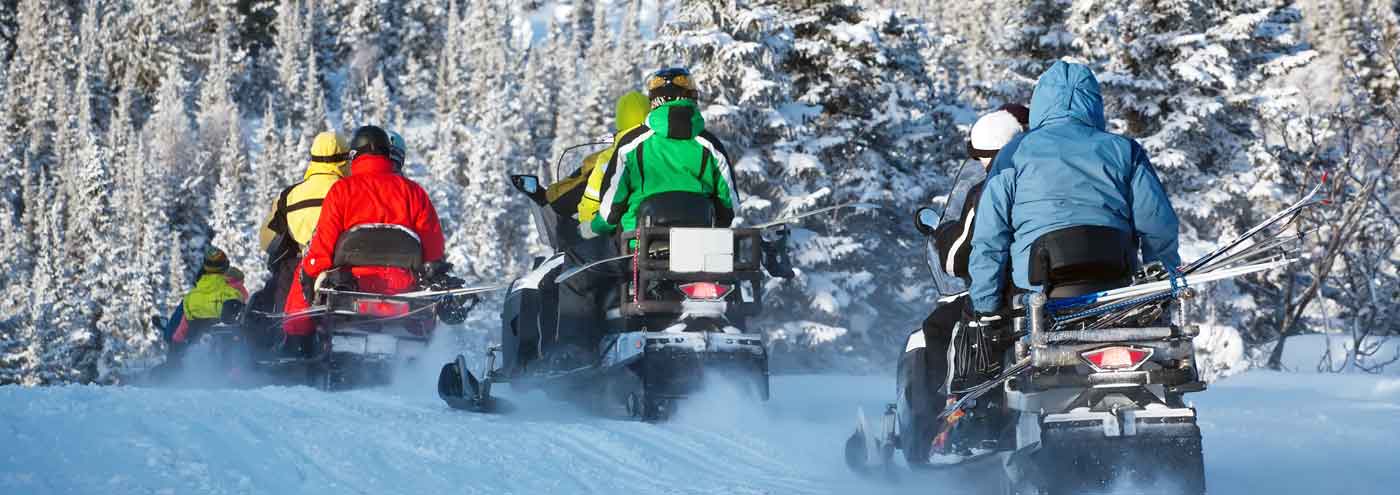
The Mountain Loop Magic trail and hiking guide is a great way to become familiar with the trails and other recreation opportunities in this area. A good place to start is the Darrington Ranger Station or the Sauk River Trading Post – both can provide lots of information about the incredible nature activities in the area. Other nearby activities include mountaineering and climbing, fishing, and rafting.
Each summer the town hosts the world-renowned Darrington Bluegrass Festival, the Classic Rock Festival, an annual archery competition, a Wildflower Festival, and many other family-oriented activities and events. In addition to the town sports, Darrington boasts an archery range, several rafting guides and a whole bunch of really great people.
Distance From
- Work:
- Everett: 60 minutes
- South Everett: 70 minutes
- Bellevue: 90 minutes
- Seattle: 105 minutes
- Skiing: 120 minutes
- Boating: 5 minutes
K-12 School District
Population
Population
| Population | 2000 | 2010 | 2025 | 2030 |
|---|---|---|---|---|
| Darrington | 1,254 | 1,347 | 1,426 | 1,452 |
Source: ESRI, 2025-08-25
Population by Age
| Population | 2025 |
|---|---|
| 0-4 | 68 |
| 5-9 | 88 |
| 10-14 | 84 |
| 15-19 | 71 |
| 20-24 | 61 |
| 25-29 | 104 |
| 30-34 | 84 |
| 35-39 | 93 |
| 40-44 | 88 |
| 45-49 | 78 |
| 50-54 | 97 |
| 55-59 | 96 |
| 60-64 | 107 |
| 65-69 | 96 |
| 70-74 | 90 |
| 75-79 | 59 |
| 80-84 | 38 |
| 85+ | 24 |
| 18+ | 1,145 |
| Median Age | 43 |
Source: ESRI, 2025-08-25
Population by Race
| Darrington | 2025 |
|---|---|
| Total | 1,426.00 |
| White Alone | 84.99% |
| Black Alone | 0.42% |
| American Indian Alone | 2.31% |
| Asian Alone | 0.98% |
| Pacific Islander Alone | 0.14% |
| Some Other Race | 1.82% |
| Two or More Races | 9.33% |
| Hispanic Origin | 4.70% |
| Diversity Index | 33.30 |
Source: ESRI, 2025-08-25
Growth Rate
| Darrington | 2025 - 2030 |
|---|---|
| Population | 0.36% |
| Households | 0.39% |
| Families | -0.49% |
| Median Household Income | 3% |
| Per Capita Income | 3% |
Source: ESRI, 2025-08-25
Housing
Households
| Population | 2000 | 2010 | 2025 | 2030 |
|---|---|---|---|---|
| Households | 519 | 567 | 605 | 617 |
| Housing Units | 553 | 644 | 643 | 654 |
| Owner Occupied Units | 460 | 477 | ||
| Renter Occupied Units | 145 | 140 | ||
| Vacant Units | 38 | 37 |
Source: ESRI, 2025-08-25
Home Value
| Darrington | 2025 | 2030 |
|---|---|---|
| Median Home Value | $620,301 | $819,553 |
| Average Home Value | $596,913 | $822,951 |
| <$50,000 | 16 | 9 |
| $50,000 - $99,999 | 26 | 2 |
| $100,000 - $149,999 | 23 | 1 |
| $150,000 - $199,999 | 6 | 0 |
| $200,000 - $249,999 | 7 | 0 |
| $250,000 - $299,999 | 16 | 1 |
| $300,000 - $399,999 | 21 | 2 |
| $400,000 - $499,999 | 51 | 20 |
| $500,000 - $749,999 | 133 | 132 |
| $1,000,000 + | 11 | 40 |
Source: ESRI, 2025-08-25
Housing Year Built
| Year Range | Houses Built |
|---|---|
| 2010 or Later | 9 |
| 2000-2009 | 68 |
| 1990-1999 | 91 |
| 1980-1989 | 109 |
| 1970-1979 | 144 |
| 1960-1969 | 89 |
| 1950-1959 | 28 |
| 1940-1949 | 66 |
| 1939 or Before | 78 |
Source: ESRI, 2025-08-25
Back To TopIncome
Income
| Darrington | 2025 | 2030 |
|---|---|---|
| Median Household | $69,394 | $81,498 |
| Average Household | $81,120 | $94,415 |
| Per Capita | $34,425 | $40,128 |
Source: ESRI, 2025-08-25
Household Income
| Darrington | 2025 |
|---|---|
| <$15,000 | 51 |
| $15,000 - $24,999 | 74 |
| $25,000 - $34,999 | 90 |
| $35,000 - $49,999 | 23 |
| $50,000 - $74,999 | 81 |
| $75,000 - $99,999 | 93 |
| $100,000 - $149,999 | 100 |
| $150,000 - $199,999 | 72 |
| $200,000+ | 21 |
Source: ESRI, 2025-08-25
Back To TopEmployees
Commute
| Category | Commuters |
|---|---|
| Workers 16+ | 535 |
| In-County Residents | 438 |
| Out-of-County Residents | 97 |
| Drive Alone | 397 |
| Carpooled | 13 |
| Public Transport | 17 |
| Work at Home | 62 |
| Motorcycle | 0 |
| Bicycle | 6 |
| Walked | 25 |
| Other | 16 |
| Less than 5 minutes | 94 |
| 5-9 minutes | 102 |
| 10-14 minutes | 14 |
| 15-19 minutes | 1 |
| 20-24 minutes | 2 |
| 25-29 minutes | 0 |
| 30-34 minutes | 4 |
| 35-39 minutes | 10 |
| 40-44 minutes | 84 |
| 45-59 minutes | 32 |
| 60-89 minutes | 103 |
| 90+ minutes | 28 |
| Average Travel Time | 0 |
Source: ESRI, 2025-08-25
Source: ESRI, 2025-08-25
Employees by NAICS
| Category | Number |
|---|---|
| Total Employees | 646 |
| Agr/Forestry/Fish/Hunt | 0 |
| Mining | 0 |
| Utilities | 0 |
| Construction | 2 |
| Manufacturing | 3 |
| Wholesale Trade | 146 |
| Retail Trade | 73 |
| Motor Veh/Parts Dealers | 2 |
| Furn & Home Furnish Str | 0 |
| Electronics & Appl Store | 0 |
| Bldg Matl/Garden Equip | 9 |
| Food & Beverage Stores | 26 |
| Health/Pers Care Stores | 5 |
| Gasoline Stations | 12 |
| Clothing/Accessory Store | 0 |
| Sports/Hobby/Book/Music | 8 |
| General Merchandise Str | 11 |
| Transportation/Warehouse | 8 |
| Information | 4 |
| Finance & Insurance | 6 |
| Cntrl Bank/Crdt Intrmdtn | 6 |
| Sec/Cmdty Cntrct/Oth Inv | 0 |
| Insur/Funds/Trusts/Other | 0 |
| Real Estate/Rent/Leasing | 5 |
| Prof/Scientific/Tech Srv | 3 |
| Legal Services | 0 |
| Mgmt of Comp/Enterprises | 0 |
| Admin/Support/Waste Mgmt | 3 |
| Educational Services | 209 |
| HealthCare/Social Assist | 60 |
| Arts/Entertainment/Rec | 4 |
| Accommodation/Food Srvcs | 48 |
| Accommodation | 3 |
| Food Srv/Drinking Places | 45 |
| Other Srv excl Pub Admin | 14 |
| Auto Repair/Maintenance | 3 |
| Public Administration Emp | 56 |
Source: ESRI, 2025-08-25
Educational Attainment (25+)
| Darrington | 2025 |
|---|---|
| <9th Grade | 38 |
| Some High School | 107 |
| GED | 100 |
| Graduated High School | 332 |
| Some College/No Degree | 150 |
| Associates Degree | 92 |
| Bachelor's Degree | 192 |
| Graduate Degree | 43 |
Source: ESRI, 2025-08-25
Back To TopBusinesses
Businesses by NAICS
| Category | Number |
|---|---|
| Total Businesses | 61 |
| Agr/Forestry/Fish/Hunt Bus | 0 |
| Mining Bus | 0 |
| Utilities Bus | 0 |
| Construction Bus | 1 |
| Manufacturing Bus | 1 |
| Wholesale Trade Bus | 2 |
| Retail Trade Bus | 11 |
| Motor Veh/Parts Dealers Bus | 1 |
| Furn & Home Furnish Str Bus | 0 |
| Electronics & Appl Store Bus | 0 |
| Bldg Matl/Garden Equip Bus | 2 |
| Food & Beverage Stores Bus | 3 |
| Health/Pers Care Stores Bus | 1 |
| Gasoline Stations Bus | 1 |
| Clothing/Accessory Store Bus | 0 |
| Sports/Hobby/Book/Music Bus | 1 |
| General Merchandise Str Bus | 2 |
| Transportation/Warehouse Bus | 2 |
| Information Bus | 1 |
| Finance & Insurance Bus | 2 |
| Cntrl Bank/Crdt Intrmdtn Bus | 2 |
| Sec/Cmdty Cntrct/Oth Inv Bus | 0 |
| Insur/Funds/Trusts/Other Bus | 0 |
| Real Estate/Rent/Leasing Bus | 2 |
| Prof/Scientific/Tech Srv Bus | 1 |
| Legal Services Bus | 0 |
| Mgmt of Comp/Enterprises Bus | 0 |
| Admin/Support/Waste Mgmt Bus | 2 |
| Educational Services Bus | 4 |
| HealthCare/Social Assist Bus | 8 |
| Arts/Entertainment/Rec Bus | 1 |
| Accommodation/Food Srvcs Bus | 6 |
| Accommodation Bus | 1 |
| Food Srv/Drinking Places Bus | 5 |
| Other Srv excl Pub Admin Bus | 7 |
| Auto Repair/Maintenance Bus | 1 |
| Public Administration Bus | 7 |
Source: ESRI, 2025-08-25
Back To Top